


Md Arman Kaishar
Dortmund-based analyst specializing in SQL, Power BI, and Tableau. I build automated reporting pipelines and KPI dashboards that translate complex logistics and financial data into clear operational decisions.
Engineering precision meets analytics
The analytical approach
Education & Languages
I turn operational, financial, sales, and inventory data into structured business insights. With an engineering foundation and Lean Six Sigma training, I focus on eliminating reporting bottlenecks and improving data accuracy.
Data Analytics & SAP ERP FI/CO specialist with a B.Sc. in Electrical Engineering. Fluent in English (C2) and German (B2/C1) for corporate environments.
Data Querying & Python
Visualization & BI
Process Engineering
Advanced SQL, CTEs, complex joins, window functions, and data cleaning pipelines paired with Python Pandas and R basics.
Interactive dashboard engineering in Power BI and Tableau, KPI monitoring, automated reporting, and advanced Excel modeling.
Lean Six Sigma methodologies, root cause analysis, forecasting, process improvement, and SAP ERP FI/CO integration.
Professional history in Germany
BI & Data Analyst
Operations & Logistics Analyst
Led reporting automation and KPI analysis. Built interactive dashboards to monitor operational performance, reducing manual data extraction and improving reporting speed.
Analyzed inventory accuracy and operational bottlenecks. Conducted root cause analysis on process errors, implementing tracking systems that supported daily shift decisions.
Data & Reporting Specialist
Business Development Analyst
Executed market data analysis and sales forecasting models. Designed performance tracking systems for executive stakeholders to guide strategic regional growth.
Managed data quality audits and automated weekly performance reporting. Integrated disparate Excel and database sources into unified operational views.
Data systems in action
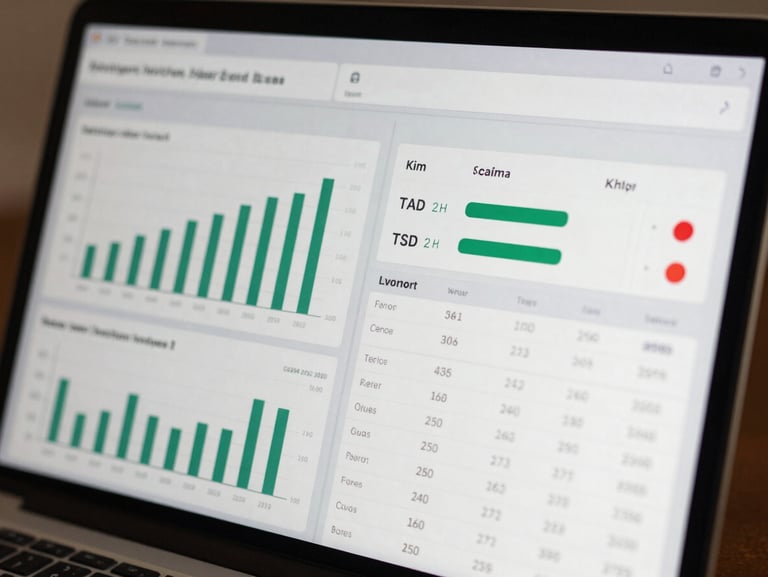
Inventory Accuracy Optimization
Developed automated KPI monitoring tools to track stock discrepancies. Applied root cause analysis to identify processing errors, resulting in a measurable reduction in inventory mismatches.
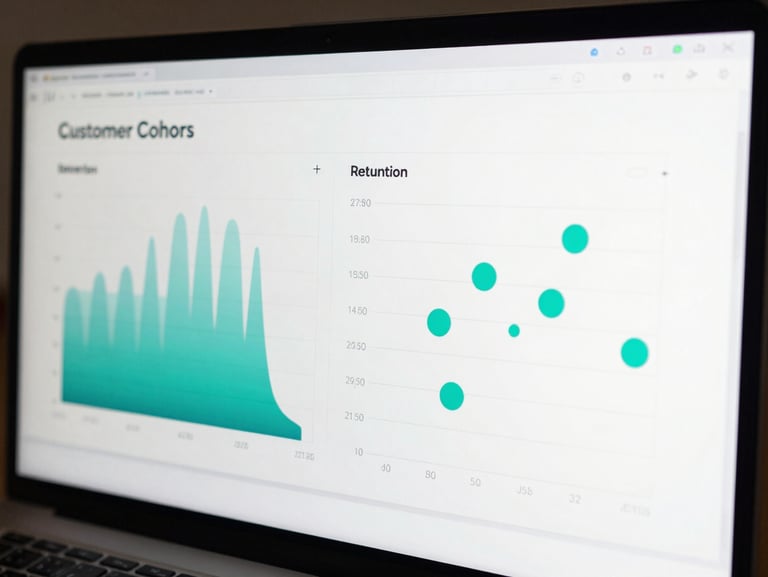
TravelTide Customer Segmentation
Wrote advanced SQL queries to segment users based on travel behavior. Built a Tableau dashboard visualizing cohort retention patterns to drive targeted marketing campaigns.
Ready to optimize your data pipelines?
I am currently accepting opportunities for Business Analyst, BI, and Data Analyst roles in Germany.